If you don’t look too closely, there is good news about the amount of CO2 and other greenhouse gases that we are putting into the atmosphere and heating the planet. Over the last 20 years or so, these emissions have been on a downward trend, and if that trend carried on we would meet the government’s emissions targets for 2037 and 2050. The problem is that a lot of the reduction in CO2 has been achieved by closing down coal-fired power stations and generating more electricity from wind and sun. Other sources of CO2 are proving much harder to reduce. To see how this works out for Havant, here are the changes in CO2 emissions from two sources over the period 2005 to 2023 (the latest year for which data is available). The red graph is for CO2 from domestic gas, i.e. gas used in Havant homes. The blue graph is for domestic electricity. Because the population has increased over this period, we have calculated CO2 per person, which is measured in tonnes on the vertical scale.
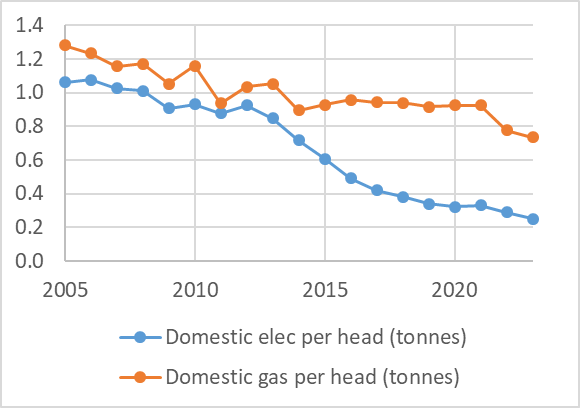
Up to 2014 the patterns are very similar, then they diverge dramatically. The graph for electricity falls away as the National Grid carries more and more electricity from zero-carbon or low-carbon generators. CO2 from gas (per person) is almost constant until 2021. There was a noticeable fall in 2022, and another smaller one in 2023, which may indicate that better insulated homes and people switching from gas to electricity are starting to make a significant difference.
What about other sources of CO2? You can download an Excel spreadsheet showing the amount of CO2 (in kilotonnes) generated by different sources, over the years 2005 to 2023. In 2023 (ignoring some sources that are insignificant for Havant), the contributions were as follows:
Industry 9%
Commerce 8%
Public sector 3%
Domestic 38%
Transport 42%
‘Transport’ makes the biggest contribution but this is a measure of all the CO2 generated during travel by road or rail within Havant Borough, not just travel by residents or businesses that are located here. For this reason it doesn’t make sense to calculate a figure per head of population, so the vertical scale of this graph shows the total in kilotonnes:
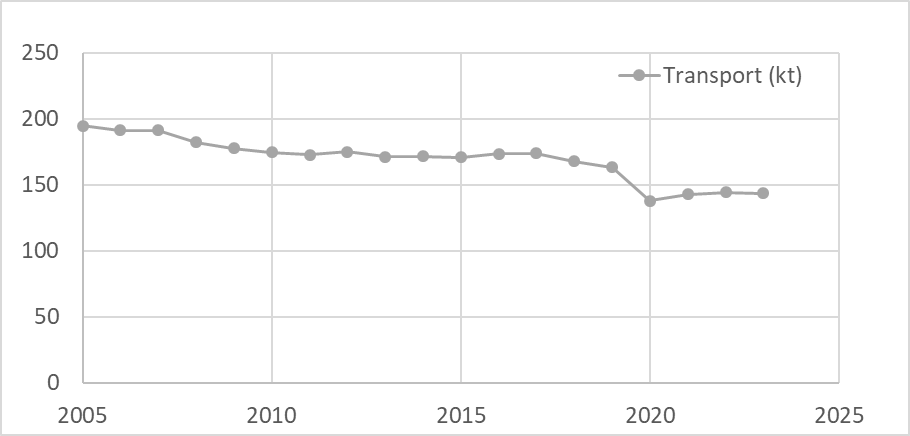
Between 2005 and 2020 there was only a small decrease in transport emissions, despite the switch from petrol-powered cars to diesel, and latterly to electric or hybrid cars, and the increasingly stringent ‘Euro’ regulations. The pattern since 2020 is very interesting, because after the sharp decrease caused by the Covid pandemic there was only a relatively small ‘recovery’, due perhaps to more people working from home. Since then the graph has been flat.
In their latest Local Transport Plan (LTP4), Hampshire County Council suggest that ‘a 10% reduction (approx.) in total car vehicle-kilometres between 2019 and 2030, combined with national and local action to encourage uptake of zero emission vehicles, would achieve the reduction in carbon emissions required by 2030.’ This calculation assumes that there is national action ‘to support uptake of zero emission vehicles in the HGV fleet’ (there is no mention of a reduction in HGV traffic).
